What is the range of tones for each style of singing bowl
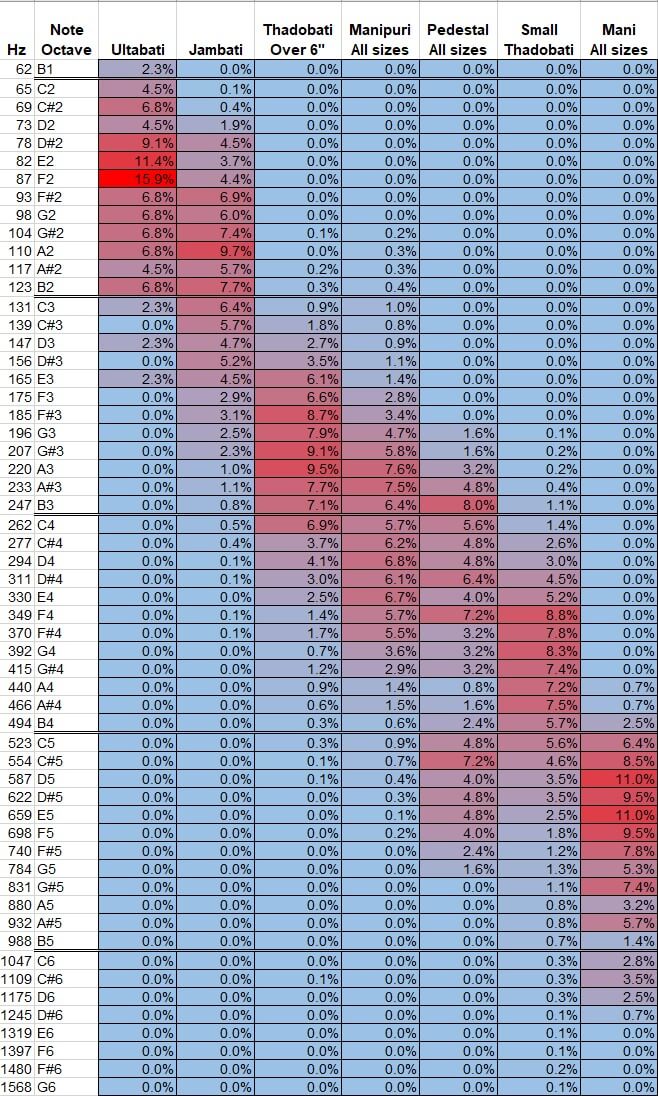
The frequency heatmap below gives you the full picture of possible tones for each of the different main styles of singing bowls. It is based on data from our decades of experience. The deeper the red color the more common the note in that style. Blue means a bowl is rare in that tone, If you see a 0.0% it means I’ve not seen any in that range.
A few caveats. Size matters. Thadobati bowls are broken out by size so you can clearly see this relationship. Some styles, like Manipuri range from small to large. At the bottom of the range will be the large bowls and at the top the small ones. The same is true of Pedestal though in that style there is a big difference in the large and small tone range so you see some blue in the middle of the range where the big ones top out and the small ones just start. Same with Mani at B5.
Another caveat is that this represents what I have bought over the years and I make an extra effort to acquire bowls at the long tail edges for each style, that is the highest and lowest they go. Consequently, those long tails are overrepresented. In the wild, the random population of singing bowls, the reds would be redder, and lots more bowls are on the market at the most common tones.
You can use this frequency heatmap to visualize what bowl types could be represented in a set either you or I assemble. Keep in mind blue means rarity and availability.
At the time of publication in 2022, this is the only map of its kind for singing bowls anywhere on the web. It probably represents the largest database of antiques ever assembled, 5 figures worth.
© Best Singing Bowls 2022 All Rights Reserved


